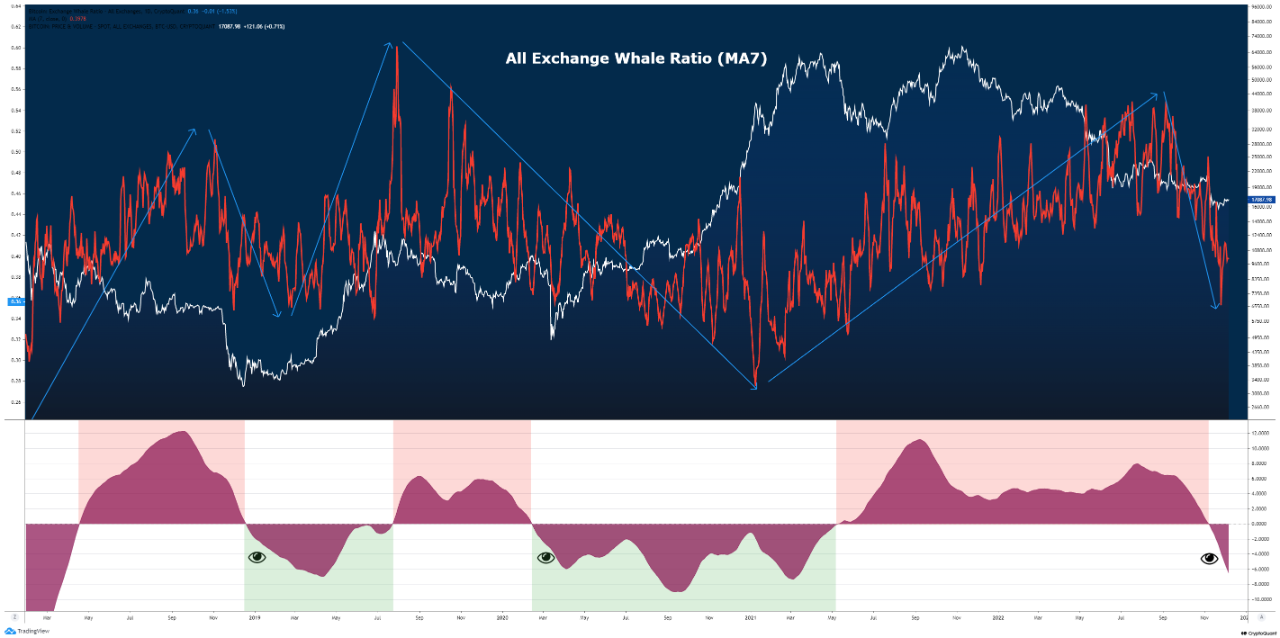
On-chain data shows the Bitcoin exchange whale ratio has sharply declined recently, a sign that may prove to be bullish for the price of the crypto.
Bitcoin 7-Day MA Exchange Whale Ratio Has Rapidly Gone Down Recently
As pointed out by an analyst in a CryptoQuant post, the metric also saw a similar decline during the end of 2018.
The “exchange whale ratio” is an indicator that measures the ratio between the sum of the top ten transactions going to exchanges, and the total exchange inflows.
The ten largest transfers to exchanges are assumed to be coming from the whales. So, this ratio tells us what part of the total exchange inflows is being contributed by these humongous holders right now.
When the value of this metric is high, it means the majority of the inflows are made up by whales currently. Since one of the main reasons investors deposit to exchanges is for selling purposes, such values could be a sign that whales are dumping large amounts, and might hence be bearish for the price of the crypto.
On the other hand, the indicator having low values suggests whales are making a healthier contribution to the inflows, and could thus be either neutral or bullish for the value of BTC.
Now, here is a chart that shows the trend in the 7-day moving average Bitcoin exchange whale ratio over the last few years:

As you can see in the above graph, the Bitcoin exchange whale ratio had a pretty high value just a few months back.
However, since then, the indicator has been observing some rapid downtrend, and the ratio has now attained quite tame values.
This means that whales have been reducing their inflow volumes recently, suggesting that selling pressure from them may be getting exhausted.
The quant has also highlighted the trend in the exchange whale ratio during the previous Bitcoin cycle in the chart. It seems like a similar downtrend as now was also seen back in late 2018, when the bottom of that bear market formed.
The analyst notes that while it’s impossible to say if the current sharp decline in the whale ratio means the bottom is in for this cycle as well, it’s likely that at least the volatility will now begin to cool down.
BTC Price
At the time of writing, Bitcoin’s price floats around $16.8k, down 1% in the last week.

from NewsBTC https://ift.tt/nc0jdIY
via IFTTT


No comments:
Post a Comment